There’s a reason that traders enter the month of October with a bit of wariness every year. Each of the poster children for stock markets crashes—1929, 1987 and 1997—occurred in October. And, what binds them together astrologically occurs again on October 24, 2019.
That binding feature is something shared by author Christopher Carolan in his book, “The Spiral Calendar.” In researching lunar cycles and the markets, Carolan discovered that what we recognize as “crash” days tended to occur on the 27th-28th day of the 7th lunar month, when the Full Moon occurred between October 3-19, inclusive.
Indeed, each of the following days not only met that criteria, but occurred on the 27th day:
- October 28, 1929—Dow Jones Industrial Average down 13%; down 17% on 10/29
- October 19, 1987—S&P 500 down 21%
- October 27, 1997—S&P 500 down 7% (circuit breaker limit).
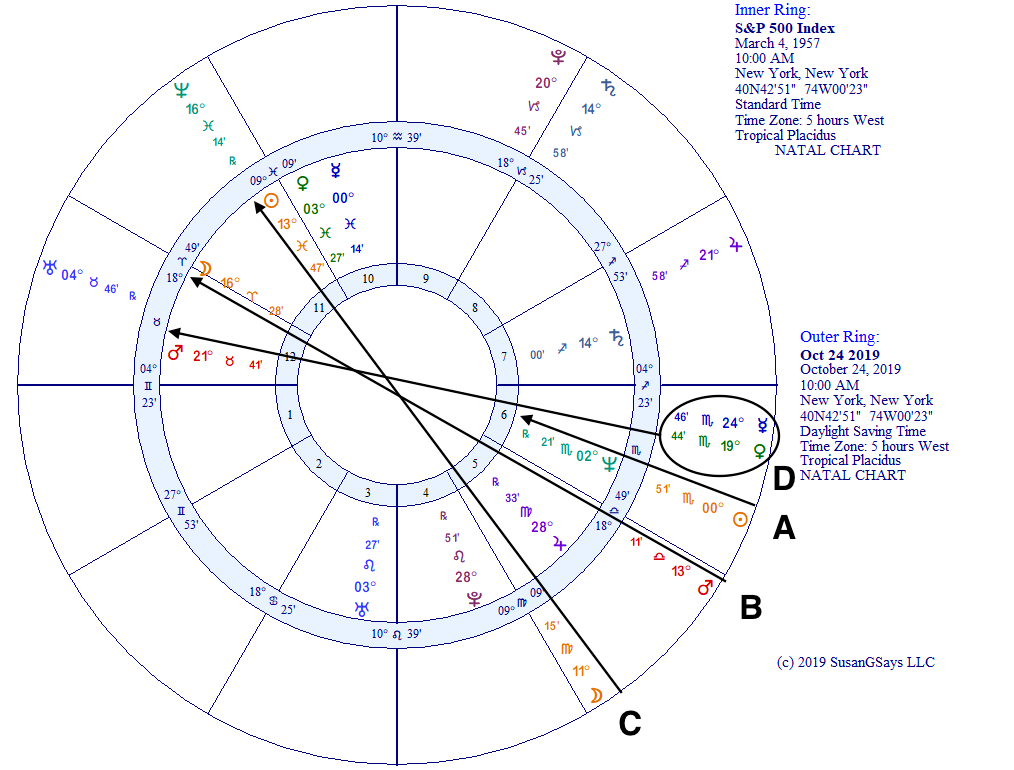
These big down days also have similar astrological transits to the S&P 500 index natal horoscope (March 4, 1957, 10 am, New York):
- Conjunction to first-trade Neptune (trine natal Venus/Mercury)
- Opposition to first-trade Moon
- Opposition to first-trade Sun.
In the figure below, the biwheel with the S&P 500 inception horoscope, these three points (plus a bonus connection) include:
- Sun conjunct Neptune (A)
- Mars opposite Moon (B)
- Moon opposite Sun (C)
- Venus/Mercury opposite Mars (D).
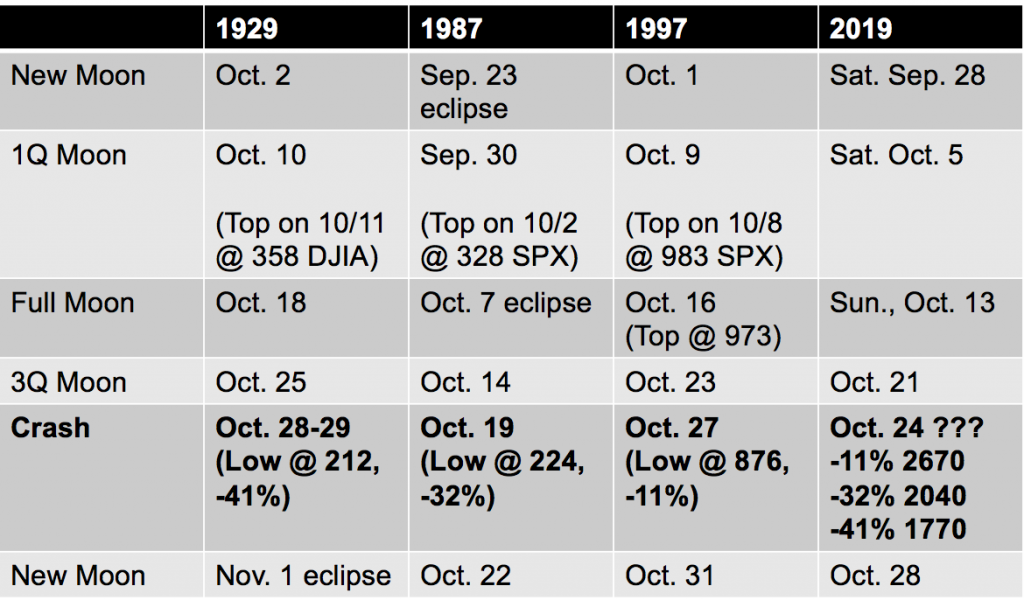
Finally, all three events share a common connection to the first-quarter Moon prior to the crash in that the market made a last-chance-to-sell high within two days of that Moon, as shown in the table below.
Dates to Watch in October
This year, the 27th day of the 7th lunar month is Thursday, October 24, and the first-quarter Moon is on Saturday, October 5, so the closest trading day is Friday, October 4.
In the three other crash events, the stock market hit ultimate crash lows that were 11%-41% below the highs made near the first-quarter Moon. This year, calculating similar percentages from recent highs near 3000 in the S&P 500, the index could bottom near the following levels by end-October:
- 2670 (down 11% like 1997)
- 2040 (down 32% like 1987)
- 1770 (down 41% like 1929).
The setup for a crash in October 2019 is the strongest between now and the end of the Saturn/Uranus 45-year cycle in 2032. Indeed, only four more years line up with all the crash criteria above. The strongest potential of these is October 21, 2022, then a runner-up on October 11, 2023. The setups in 2030 and 2031 are no more than maybes.