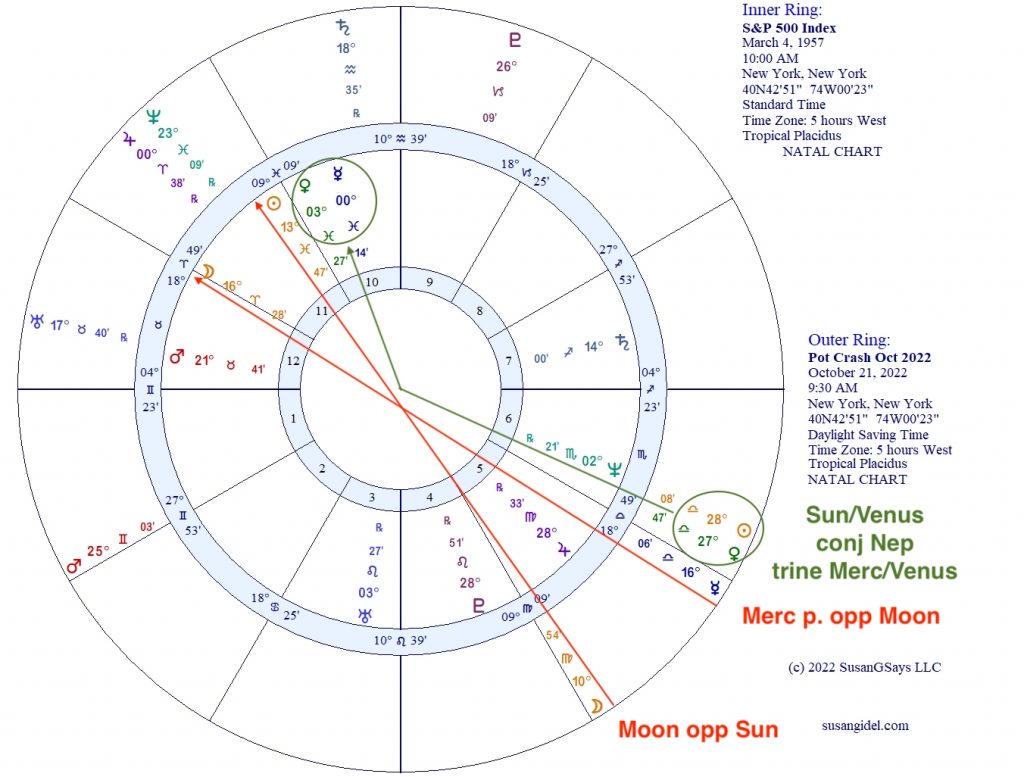
Two of the most memorable U.S. stock market crashes occurred in October—on October 28, 1929—the kickoff to the Great Depression—and October 19, 1987—when the Standard & Poor’s 500 fell 21% in a single day and led to today’s circuit-breakers. So, it’s no wonder that investors approach the month with caution.
Friday, October 21, 2022 sets up astrologically in similar ways to those two previous market crashes. So does the “last chance” to sell ahead of the crash, near the preceding first-quarter moon. This year, that is on Monday, October 3, 2022.
I’ve studied these two famous American market crashes versus the first-trade horoscope of the Standard & Poor’s 500 index, even though it launched in 1957, which was 28 years after the 1929 crash.
It may seem odd to compare the 1929 crash vs. an index that didn’t exist at the time, but the S&P 500 is so tightly connected to the horoscope of the United States, the New York Stock Exchange, important securities events and derivative products that I consider it the “mother chart” for all things equity-market oriented.
Here’s the main three planets and aspects to watch for in a potential stock market crash:
- Transiting Moon opposite S&P 500 first-trade Sun at 13 Pisces. In 1929 and 1987, the Moon was at 17-18 Virgo; in 2022, it will be at 10 Virgo.
- Planets opposite S&P 500 first-trade Moon at 16 Aries. In 1929, Mercury and Venus were at 17 Libra and 10 Libra, respectively. In 1987, the Sun was at the outer edge of opposite, at 25 Libra. This year, Mercury will be exactly opposite, at 16 Libra.
- Planets conjunct S&P 500 first-trade Neptune at 02 Scorpio (which also make them trine first-trade Mercury and Venus at 00-03 Pisces). In 1929, the Sun was at 04 Scorpio. In 1987, Mercury, Venus and Pluto in Scorpio were beyond Neptune by degree, but trine the S&P 500’s first-trade Sun at 13 Pisces; the transiting Sun was widely conjunct Neptune at 25 Libra. In 2022, the Sun and Venus are both within 5 degrees of Neptune, at 27-28 Libra.

“Last Chance” at First-Quarter Moon
So, although it might be nice to be prepared for a market crash (defined as the big down day that grabs headlines), what is more interesting (at least to me) is when would have been the last chance to sell before the big decline started. Once again, astrology has the answer.
The most recent first-quarter Moon before the potential crash has marked the “last chance” to sell before the decline that culminates in a crash.
In 1929, the market topped on October 11 at 358.77, basis the Dow Jones Industrial Average, just one day after the first-quarter moon. (The Dow’s 1929 peak at 386.10 on September 3 was not surpassed for 25 years.) By October 29, it had fallen 41% to a low at 212.
In 1987, the market topped on October 2 at 328, basis the S&P 500, two days after the first-quarter moon. On October 19, the market fell 21% in a day, ultimately losing 34% from the early October high.
One never knows what the markets will do, but I think it will be wise to be prepared for market turmoil in October. Stay alert to fundamental news and behavior of your favorite technical indicators to see if they confirm or deny the possibility of a crash on October 20-21.
This is the first of only four such crash-potential setups through 2032. The others are in 2023, 2030 and 2031. The most recent previous set-up was in October 2019. That pattern held through the first-quarter moon, but fell apart shortly thereafter when prices gapped higher through the first-quarter moon rebound high.
(c) Copyright 2022 SusanGSays LLC