By Susan Abbott Gidel
The U.S. stock market could decline at least 30% by early 2026 based on a months-long aspect between Saturn and Uranus, planets that hold long-term sway in financial matters. That would put the Dow Jones Industrial Average near 32,000. The sextile (60-degree) aspect is first exact on April 4, 2025 and continues until January 20, 2026.
Conveniently, the 45-year Saturn/Uranus cycle (from conjunction to conjunction) aligns with the start of the Dow Jones Industrial Average, so comparing the planetary cycle against the stock market is a revealing exercise. The DJIA was first calculated on May 26, 1896. Saturn and Uranus started their 45-year cycle just a few months later, on January 6, 1897. Given the cycle’s length, this time difference is insignificant.
This first cycle that can be compared with the DJIA lasted from 1897 to 1942. The second Saturn/Uranus cycle was from 1942 to 1988. We are currently in the final stages of the third cycle since the DJIA began, spanning 1988-2032.
Generally, in each of these three cycles, the DJIA behaved similarly at similar stages of the Saturn/Uranus cycle:
- Stock market low for the 45-year period at the initial conjunction. (TBD in the current cycle, but the Crash of 1987 low at DJIA 1616, just four months prior to the conjunction, would be the mark to watch.)
- Record stock market high near the first square (90 degrees apart), opposition (180 degrees apart) and second square (270 degrees apart) of the planets. In the current cycle, these were: (1) the dot.com high in 2000 at 11,750; (2) the pre-Great Recession high in 2007 at 14,198 (early; first of five Saturn/Uranus oppositions occurred in November 2008); and (3) the 2022 high at 36,952.
- Subsequent correction into the second sextile (300 degrees apart) of the planets. In the 1897-1942 cycle, this was a decline of 89% from the 1929 high at 386 to the 1932 low at 40. In the 1942-1988 cycle, this was a decline of 29% from the 1976 high at 1026 to the 1980 low at 729. (TBD in the current cycle, but working from the December 2024 high at 45,073.)
- The final high for the 45-year period was 3.8-4.8 times that correction low. The 1937 high of 195 was 4.8 times the 1932 low. The 1987 high of 2746 was 3.8 times the 1980 low.
Chart 1 shows the entirety of the current Saturn/Uranus plotted against the DJIA since 1988. The vertical purple lines on the right show when Saturn is sextile Uranus, exact three times on April 4, 2025; August 11, 2025; and January 20, 2026. Based on the two previous cycles since 1896, I’m looking for the DJIA to decline, at minimum, 29% to about 32,000 (like the 1942-1988 cycle) no later than the first quarter 2026.
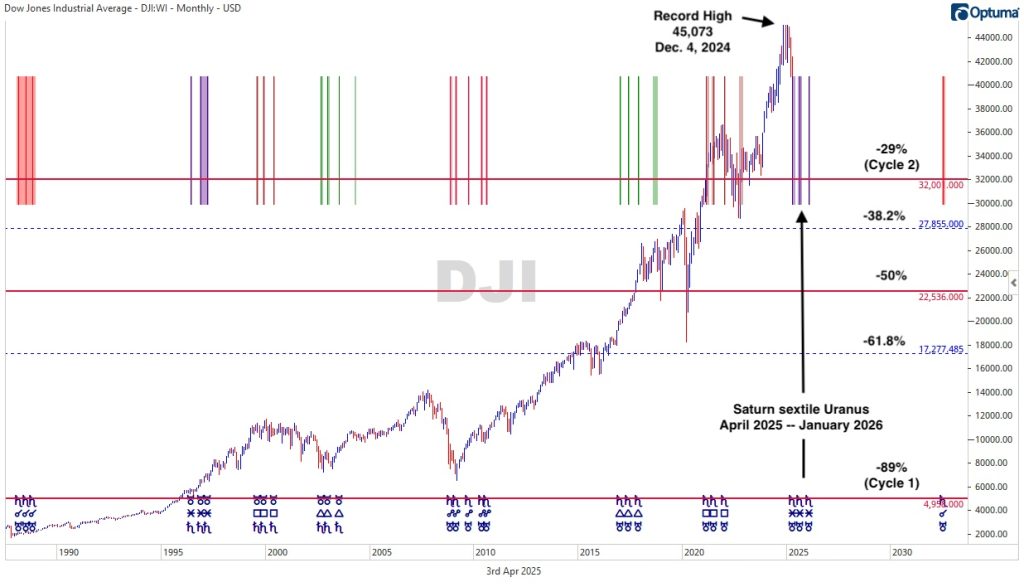
Chart 1
A second red horizontal line marks a 50% decline from the current record high, to a low of about 22,500, just above the Covid low of March 2020 at 18,213. The third red horizonal line shows a potential low of about 5,000 if the Great Depression correction repeats. The blue dotted lines show correction targets based on Fibonacci calculations—about 28,000 for a 38.2% correction, and about 17,000 for a 61.8% correction.
Chart 2 projects how the DJIA could behave between now and the end of the Saturn/Uranus cycle in 2032 if the market follows its historical precedents of correction percentages and subsequent rallies (just the 3.8 multiplier calculated here.)
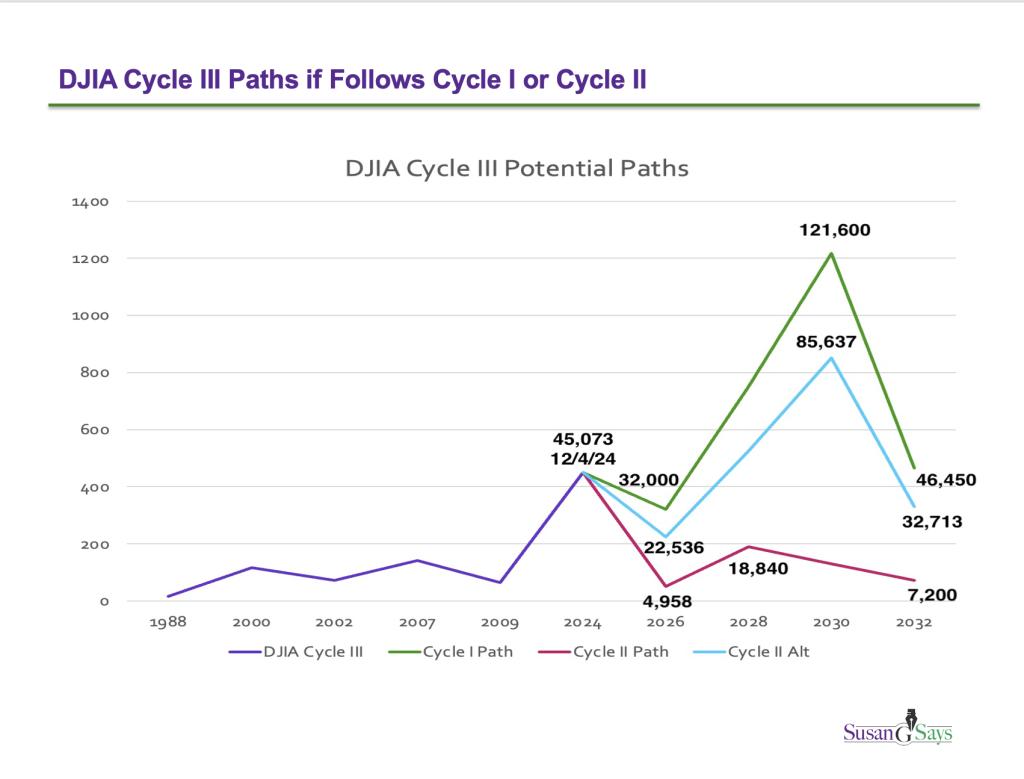
Chart 2
The good news is that, barring another Great Depression, the DJIA could reach new record highs by 2030, based on the history of the Saturn/Uranus cycle. Then, Jupiter opposing both Saturn and Uranus that year could set the ultimate top and send the DJIA to its next 45-year low in 2032. Those lows in Chart 2 are calculated as a 50% correction.
All information is merely the personal opinion of the author and not that of any other person, company or entity. This information is not to be construed as financial advice, nor relied upon as such. Please contact your broker or financial advisor for trading and investment advice, and use astrological indicators in combination with other trading-decision inputs. Past results are not necessarily indicative of future market behavior.
© Copyright 2025 SusanGSays LLC