(All times Eastern)
For the first time since I began writing/publishing the Red Letter Trading Days newsletter in November 2013, all the planetary connections in the sky on trading days are in “hard” aspects, i.e., conjunction, square or opposition. That means each of the days noted for this month are in red type. Indeed, that tells us that the planetary energy for all of us on Earth and the markets is difficult throughout the month. On the upside, hard aspects are the ones that spur action and get things done.
April 15 as Top Red Letter Trading Day
The most difficult period appears to be April 14-15, when the transiting Sun is first square Pluto (90 degrees apart), then square Jupiter the next day. I’ve selected Wednesday, April 15 as this month’s Top Red Letter Trading Day not only because of these two squares, but also because the March figures for U.S. retail sales and industrial production will be released that day and provide the first insight into the effect on both from the coronavirus outbreak.
The one-two punch of Sun square Pluto and Jupiter suggests tension and frustration from leaders (the Sun) with the coronavirus outbreak as Pluto rules viruses and Jupiter expands what it touches. Jupiter and Pluto are exactly conjunct on April 4 for the first of three such connections this year. The other dates are June 30 and November 12, which suggests that the issues of both the virus and the monetary solutions surrounding it are not resolved until after the presidential election.
Jupiter/Pluto and Venus
The Jupiter/Pluto conjunction is important because it happens only once about every 12 years. The last time these two planets were conjunct (same degree of same sign) was in December 2007, just before Pluto entered Capricorn to kick off its 16-year transformation of business and government in January 2008 and just three months after the stock market peaked in October 2007.
Venus, the planet that rules money, also is in the mix with Jupiter/Pluto, but in an easy flowing 120-degree trine. All three together scream “throwing lots of money at a big problem,” which is exactly what happened when a $2.2 trillion stimulus package was signed into law on March 27, the day before Venus was trine both Jupiter and Pluto to the degree.
Starting on Friday, April 3 and continuing through June 2, Venus will be “out-of-bounds,” which means it will behave with a mind of its own and unpredictably. With Jupiter and Pluto within 2 degrees of each other throughout April, the virus expansion and big money to solve it remain hot topics; with Venus out-of-bounds, the potential financial solutions and funding may resemble throwing spaghetti at the wall to see what sticks. Then, at month’s end, Pluto turns retrograde in motion through October 3, bringing a review of the entire situation over the next five months.
There is just a single trine aspect the entire month—on Saturday, April 4—when Venus in Gemini is 120 degrees away from Saturn in Aquarius. That connection (the same day as Jupiter conjunct Pluto) facilitates thoughtful financial planning, particularly if approached with an out-of-the-box approach.
February High is For Real
In last month’s overview letter, I was holding judgment on whether the February 19 high at 3393.52 in the S&P 500 was the ultimate or penultimate high in the 45-year Saturn/Uranus cycle. After watching the S&P lose 35% in not quite five weeks to hit a low of 2191.86 on March 23, I consider the February high to be that ultimate or penultimate high between now and 2032, the start of the next Saturn/Uranus cycle.
That opinion will be wrong, in my eyes, if the S&P 500 rallies (and closes) significantly beyond 2900 before early May, the last-chance timeframe for a high in the index until after the presidential election based on astrological transits to the index’s natal horoscope. Some levels to watch closely include (see “Rally Potential Zone” on chart in March Review section below):
- 2791 (50% retracement of the decline)
- 2853—2863 (Venus/Sun’s end-of-cycle conversion levels)
- 2882—2901 (March 6-10 gap area)
- 2896 (Moon’s conversion level)
- 2933 (61.8% retracement of the decline).
This month’s dates of astrological note include:
- April 3 Venus enters Gemini
- April 3 Venus goes out-of-bounds through June 2
- April 4 Jupiter conjunct Pluto in Capricorn (1/3)
- April 7 Full Moon in Libra
- April 11 Mercury enters Aries
- April 19 Sun enters Taurus
- April 22 New Moon in Taurus
- April 25 Pluto retrograde through October 3
- April 27 Mercury enters Taurus
This month’s dates for potential market trend changes, based on planetary connections to natal first-trade horoscope charts, include:
Crude Oil
- Highs on April 14, April 22, April 30
Euro FX
- Low on April 21
Gold
- Highs on April 23
- Low on April 13, April 29
Soybeans
- High on April 28
- Lows on April 2, April 7
S&P 500
- High on April 21
- Low on April 3
- Tossup High or Low on April 13
10-year T-note
- Low on April 9
Red Letter Trading Days for April 2020
Low in Soybeans on Thursday, April 2–Pressing down on prices is: (1) the transiting Sun is opposite the market’s natal Sun position; and (2) Mars, Jupiter, Saturn and Pluto opposing the market’s natal Pluto position, with the Moon conjunct Pluto. Giving prices a lift is that transiting Venus and Mercury form a Grand Trine with the market’s sensitive natal Mercury. In May beans, the $8.73-$8.75 per bu. area is significant support/resistance from the planetary price conversion table. The next price conversion level lower is $8.38; the next higher is $8.87.
Friday, April 3—Money Goes Wild
Venus, the planet that rules money, is in the spotlight on Friday, April 3. First, it leaves its ruling sign of Taurus to enter Gemini at 1:11 pm, which is a downtick in energy. However, Venus also goes “out-of-bounds” on Friday for the next two months, so is like a colt who broke out of the pasture—kicking up its heels and uncontrollable!
During Friday’s trade, Jupiter and Pluto are building strength into their exact conjunction in Capricorn at 10:45 pm Saturday. This combination magnifies the issue of Pluto working on transforming business and government; however, it also can provide optimism about the situation. This is the first of three conjunctions between these two planets, with others on June 30 and November 12. Thus, expect the ginormous coronavirus issue and its massive government response to be reviewed in late June and not resolved until after the election.
Also on Saturday, Venus is working well with Saturn in Aquarius to come up with a solid financial plan that is both innovative and detail-oriented. At the same time, Venus remains in range to help fund the massive Jupiter/Pluto initiatives (but potentially by throwing caution to the wind as it is out-of-bounds).
Finally, take what you hear over the weekend with a grain of salt. Mercury, the planet that rules communications, is conjunct Neptune in Pisces at 9:15 pm on Friday. This connection is prime for deceptive messages—or inspired, intuitive thoughts.
Low in S&P 500—A big surprise could be behind a potential low on April 3. That’s because the S&P 500’s natal Uranus is opposed by both Mars and Saturn in Aquarius—the sign co-ruled by Saturn and Uranus. At the same time, Jupiter and Pluto are each at 24 Capricorn, forming a Grand Trine with the index’s natal Mars and Jupiter. Finally, the transiting Sun is conjunct the market’s natal Moon. The end-of-cycle Venus/Sun conversion levels of 2493-2503 could provide support, as could 2404 and 2338. The next big downside planetary conversion support rests at 2290.
Friday’s reports include:
- Thursday 8:30 pm Japan PMI Composite
- Thursday 9:45 pm China General Services PMI
- TBD Reserve Bank of India announcement
- 4:30 am Great Britain CIPS/PMI Services Index
- 5:00 am Eurozone Retail Sales
- 8:30 am US Employment Situation
Tuesday, April 7—Breakthroughs Spotlighted
Watch for breakthroughs late in the trading day on Tuesday, April 7 as feisty Mars squares off against upset-king Uranus at 2:50 pm. This pair of planets is known for providing surprises when they are in “hard” aspect like they are on Tuesday, so stay tuned in all day as their aspect strengthens into exact.
In overnight trading for Wednesday, the Full Moon occurs at 10:35 pm, putting a spotlight on whatever Mars and Uranus might have cooked up. The Full Moon makes its own square aspects to Jupiter and Pluto, so also highlights big powerplays. Note that the Fed releases minutes of its unscheduled meetings of March 3 and March 15 on Wednesday at 2 pm.
Low in Soybeans on Tuesday, April 7—The soybean market’s natal Mercury receives a most intense connection from transiting Venus, Mars and Saturn that together form a big triangle that typically leans bullish. At that night’s Full Moon in Libra, the Moon is conjunct the market’s natal Sun while the Sun is opposite its natal position. In the May contract, planetary price conversion support could be at $8.38 per bu.
Low in 10-yr. T-note on Thursday, April 9—The Sun makes its annual opposition to the position of Saturn and Pluto in the 10-yr. T-note horoscope chart, bringing a culmination of depressing energy. At the same time, the transiting Moon is opposite the market’s natal Sun. In the June contract, watch the planetary price conversion level of 136-08 for support.
Holiday Hours
The NYSE and CME Globex markets close at their regular times on Thursday, April 9 for the Good Friday holiday. CME Globex markets reopen at their regular times on Sunday, April 12.
Tuesday’s reports include:
- Monday 4:00 pm US Crop Progress
- Monday 7:30 pm Japan Household Spending
- Monday 9:30 pm Australia Merchandise Trade
- 12:30 am Australia RBA Announcement
Monday, April 13—Gold & S&P Potential Turns
A special edition of Red Letter Trading Days to bring you information about two potential market turns. See you again on Monday afternoon.
Low in Gold on Monday, April 13—The market’s first-trade Venus gets hit hard by a 90-degree aspect from the transiting Sun while Jupiter and Pluto remain in range as conjunct as they have been since the end of February. Also significant is that the transiting Moon is aligned with the market’s first-trade Sun. In June gold, look for support from three planetary price conversion levels ranging from $1688-$1694 per oz.; the next level lower is $1651.
High in S&P 500 on Monday, April 13—Based on planetary transits to the index’s natal horoscope, this day is a toss-up between a high or a low in the S&P 500. Because the market has been rallying, I’ll go with “high.” Arguing for a high are that transiting Venus and Mars are conjunct two of the first-trade chart’s “angles,” with the Son conjunct first-trade Moon. Arguing for a low are the 120-degree aspects between transiting Jupiter/Pluto and first-trade Mars, as well as the trine to Pluto from the transiting Sun. The planetary price conversion levels to watch for resistance include 2830, 2850 and end-of-cycle 2853-2863.
Tuesday, April 14—Leaders vs. Transformation #1
The first of a one-two punch from the transiting Sun occurs at 7:07 am on Tuesday when it makes a 90-degree square to Pluto. The Sun in Aries represents feisty leaders who want to get their own way, but are running into issues with other powers who want to transform business and government. The second of the two punches comes on Wednesday, when the Sun is square Jupiter. More on that tomorrow.
Low in Crude Oil on Tuesday, April 14—Tension-filled aspects put pressure on prices, especially as money planet Venus is opposite the market’s natal Jupiter and Uranus. In addition, the Sun makes a tight conjunction with natal Mars, while Jupiter, Pluto and the Moon are 90 degrees away. In the May contract, look for planetary price conversion support at $21.20-$21.28.
Tuesday’s reports include:
- Monday 4:00 pm US Crop Progress
- Monday TBD Monetary Authority of Singapore Announcement
- 6:00 am US NFIB Small Business Optimism Index
Wednesday, April 15—Leaders vs. Transformation #2
Wednesday, April 15 is this month’s Top Red Letter Trading because it is the second of the Sun’s one-two punch with heavyweights Pluto and Jupiter.
On Tuesday, the Sun in Aries (feisty leaders) was in a square with Pluto in Capricorn (transforming business and government). Today, the Sun is square with Jupiter in Capricorn, exact at 6:59 am. The square with Jupiter, the largest planet in the sky, only exacerbates the issues and reveals the enormity of the problems involved with the long-term job of transformation. Because Jupiter also rules the law, the Sun’s square to it has an additional flavor of fighting over rules and legal authority.
Wednesday’s reports include:
- 2:45 am France CPI
- 4:00 am Italy CPI
- 8:30 am US Retail Sales
- 9:15 am US Industrial Production
- 10:00 am Bank of Canada Announcement
- 10:00 am Bank of Canada Monetary Policy Report
- 10:30 am US EIA Petroleum Status Report
Monday, April 20—Leaders Fixed
Everyone in a position of power is digging in their heels for the next month as the Sun entered the sign of Taurus on Sunday morning. The Sun, representing leaders of every stripe, left the sign of Aries, where every wish is its command. Taurus is a fixed Earth sign, so leaders now will take the attitude of slow-and-steady-wins-the-race. Steadfast and reliable are the high-road expressions, while stubborn and immovable are those of the low road.
Monday’s reports include:
- Sunday 6:45 pm New Zealand CPI
- Sunday 7:50 pm Japan Merchandise Trade
Tuesday, April 21—Leaders vs. Ideas
The tension continues on Tuesday, April 21 as the Sun in Taurus makes an exact 90-degree square to Saturn in Aquarius at 3:00 am. This energy suggests that stubborn leaders resist new, unusual approaches to establishing order. Two markets could be making price turns—a low in Euro FX and high in the S&P 500.
Low in Euro FX on Tuesday, April 21—The Moon, Mercury and Mars are tickling the market’s natal Venus, the planet rules money and currency. At the same time, the power pair of Jupiter and Pluto are easily supporting the market’s natal Sun and Mars in Taurus, a sign ruled by Venus. In the June contract, there is significant support at 1.0720-1.0730, based on planetary price conversion levels.
High in S&P 500 on Tuesday, April 21—The Moon and Mercury are aligned with the index’s natal Moon, a planet associated with previous highs. Meanwhile, the money planet Venus is opposite the index’s natal horoscope to the degree, signifying a restriction on money. Resistance remains in the 2850-2863 range, based on planetary price conversion; the next levels higher are 2896, then 2931-2944.
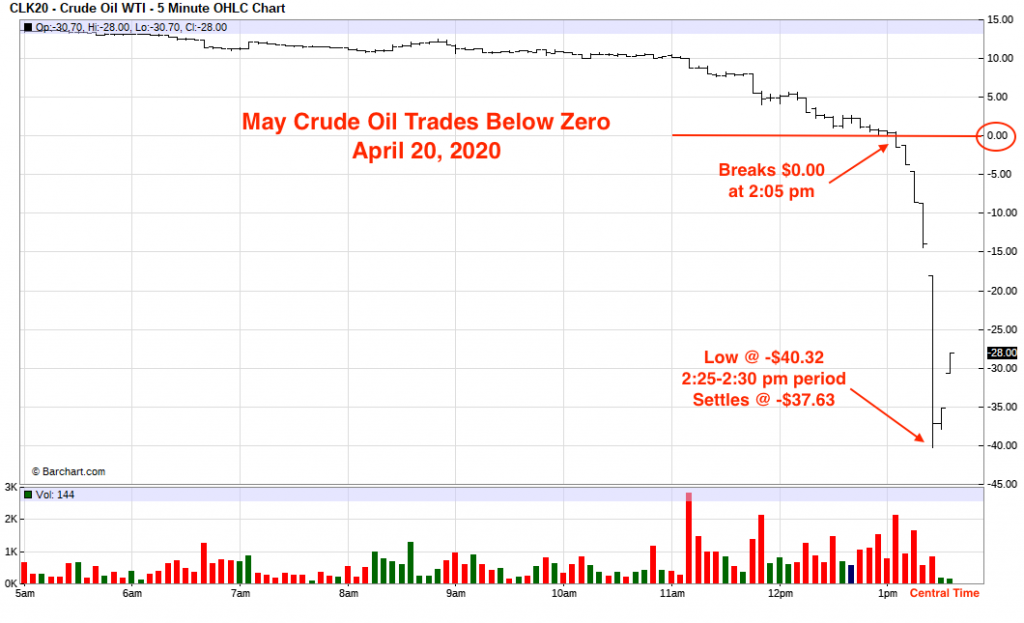
Expiring May Crude Oil Goes Negative
I witnessed something on Monday, April 20 that I thought was impossible in the commodity markets—prices that were below zero. What I had been taught way back in the day was that although a company’s stock could go to zero if it went bankrupt, a commodity would never do that because it would always have value as a physical good. To settle at a negative price means that the oil seller must pay a buyer to take the oil. “Here, this oil is free, and I’m willing to pay you even more to take it off my hands.”
But, I watched it with my own eyes, glued to the CNBC television screen, as prices for the May WTI contract at NYMEX fell from $0.03 per barrel to -$40.32 in just 25 minutes (see chart below). It felt the same as watching the Crash of 1987 on the Quotron machine from my office at CBOE and the “Flash Crash” of 2010 on CNBC from my office at the CBOT–not believing what you’re seeing, yet unable to turn away.
The day’s close of -$37.63 was a decline of more than 300 percent. The May contract officially expires at 2:30 pm on Tuesday, April 21. (As I write this, May oil is trading in the overnight Globex market at about -$6.00.)
Meanwhile, the almost-front month of June closed on Monday at $20.43, down $4.60 for the day. So, it appears the issue is not within the cash market, otherwise June futures would have come under similar pressure. Here’s how the five-minute bar chart for May crude oil looked today:
In watching the commodity markets for more than 40 years, I am bewildered about how this could happen. To be clear, it does not surprise me that there are no daily price limits (circuit breakers) in an expiring month as the goal of a futures contract at expiration is to get futures and cash prices to converge.
However, it does surprise me that what typically is seen to prevent/control classic “short squeezes” that send prices sharply higher into expiration were not applied in the converse, which I’m trying to think of as a “long squeeze” sending prices lower.
For example, “liquidation only” trading was used to halt the short squeeze in the 1980 silver market, and resulted in the market trading limit down for days and days and days. Liquidation only means that no new market participants can trade the contract, i.e., open interest is prohibited from increasing. Only those with existing positions can trade, and they can trade only to exit their current position. As of Friday, April 17, with two trading days until the May expiration, more than 100,000 contracts remained open in the May contract. For comparsion, that equals about 20% of the open interest in the June contract. That level seems remarkably high to me.
In addition, I have always understood that the exchanges (in this case, CME Group) and industry regulator, Commodity Futures Trading Commission (CFTC) watch the positions of both longs and shorts like a hawk going into expiration. My impression always has been that there are lots of phone calls and jawboning extraordinaire to ensure these market participants close out their positions in an orderly fashion or are perfectly prepared to make or take delivery.
There no doubt is more to this story than what we have seen so far on a price chart. And, it likely involves the fast-disappearing storage space available to put barrels of crude oil in our current lockdown, limited travel situation, as the WTI contract calls for final settlement by physical delivery in Cushing, Okla. Indeed, we are in unprecedented times.
In the meantime, today’s astrological patterns vs. the first-trade horoscope chart I watch for WTI crude oil showed nothing extraordinary. Indeed, I’m looking for prices to rally into a peak on Wednesday.
High in Crude Oil on Wednesday, April 22—Five planets in the sky are aspecting the market’s natal Mars and Moon. The almost New Moon (exact Wednesday night) means that the Sun and Moon are both aligned with crude oil’s natal Mars and opposite the market’s natal Moon. The Mars connection adds to the underlying pressure this year due to a 90-degree square from Pluto and Jupiter. In the June contract, potential resistance exists at $26.30-$26.90 per barrel based on planetary price conversion levels; $28.48 is an end-of-cycle conversion level.
Tuesday’s reports include:
- Monday 4:00 pm US Crop Progress
- 4:30 am Great Britain Labour Market Report
- 8:30 am Canada Retail Sales
- 10:00 am US Existing Home Sales
Thursday, April 23—Security Plans
With the New Moon in Taurus at 10:26 pm Wednesday, it brings the Sun, Moon and Uranus together in a 90-degree square to Saturn in Aquarius. This connection emphasizes the tension between leaders focused on security and inventive plans of action. With the luminaries aligned with Uranus, Thursday’s trade could be reacting to the Uranus wild card from the leadership side.
High in Gold on Thursday, April 23—Three planets—Sun, Moon, Uranus—are all in the powerful trine aspect to the gold market’s first-trade Sun position. In addition, transiting Mars is opposite the natal position of the Moon in gold’s first-trade horoscope, and transiting Venus is opposite natal Mars. These three aspects to the Sun, Moon and Mars are among the strongest seen at gold market highs.
In the June contract, watch $1761 per oz. as potential resistance as well as $1783, which is the end-of-cycle conversion level from Jupiter. Beyond that, the next three conversion levels are $1868, $1905 and $1933. (Gold’s all-time high on monthly continuation charts is $1920.80.)
May Crude Oil Followup
The WTI crude oil futures contract for May 2020 delivery at NYMEX, which dropped to an unprecedented negative price of $40.32 per barrel on Monday, April 20, expired the following day in the positive at $10.01. It appears that Monday afternoon’s flash crash into negative territory likely was related to long-holder capitulation.
One theory is that massive sell stops were hit as prices touched $0.01 (potentially on the belief that prices could not drop below zero, even though CME Group had made it clear on April 8 and April 15 to clearing member firms that it was technically prepared to handle negative prices); another is that intraday margin calls from brokers induced forced selling at any price. Indeed, one of the larger brokers in the business, Interactive Brokers, reported that the firm made good to clearinghouses on $88 million in losses in their customer’s accounts.
It is my opinion that the NYMEX WTI crude oil futures contract will have a tough time retaining its viability without swift action that amends the current delivery requirement into Cushing, Oklahoma. Cash settlement (like the ICE Brent crude oil contract) or additional delivery points could be potential fixes.
Thursday’s reports include:
- Wednesday 8:30 pm Japan PMI Composite Flash
- 3:15 am France PMI Composite Flash
- 3:30 am Germany PMI Composite Flash
- 4:00 am Eurozone PMI Composite Flash
- 4:30 am Great Britain Retail Sales
- 8:30 am US Jobless Claims
- 9:45 am US PMI Composite Flash
- 10:00 am US New Home Sales
Monday, April 27—Rethink Transformation
Trading begins the week on the heels of some big weekend energy shifts. The most notable is that Pluto turned retrograde in motion on Saturday. In Capricorn, Pluto’s job is to transform business and government from what was the status quo in 2008 to something new by 2024.
During this retrograde period, Pluto will retrace the forward progress it made since January 4, 2020. So, pretty much everything coronavirus-related that has affected business operations and government actions this year so far will be up for review and reexamination during the retrograde period, which ends on October 3.
On Sunday morning, the Sun was exactly aligned with Uranus in the sign of Taurus. The Sun represents leaders, Uranus represents surprises and Taurus represents money/security. So, even into the end of April, be on watch for unexpected news from world leaders (including the Fed at this week’s meeting) that could affect the financial markets.
The final astrological event of the weekend was that Mercury in Aries was in a tension-filled square with Pluto on Saturday and Jupiter on Sunday. Mercury in Aries is probably the planet that coined the phrase, “them thar’s fightin’ words.” In a square to two slow-moving planets in Capricorn, anger about Pluto’s transformation (or about Pluto’s secrets) gets blown up out of proportion with Jupiter’s help. These influences extend into Monday afternoon, when Mercury calms down as it enters Taurus at 3:53 pm, right before the NYSE close.
No reports of significance occur on Monday.
Tuesday, April 28—Rock Meets Hard Place
Mercury (the planet that rules communications, trading and stock indexes) makes a 90-degree square to the great constrictor, Saturn, at 1:28 pm. Both planets are in fixed zodiac signs, so are more intent on holding their ground than bending in cooperation.
The FOMC meeting occurs under this influence, so don’t expect much alteration to its overarching plan when meeting results are announced at 2:00 pm Wednesday. The plan is the plan is the plan. This transit also could produce heated differences of opinion about inventive plans.
As this is the final newsletter for April, following are potential market highs and lows through Thursday, April 30:
- High in Soybeans on Tuesday, April 28—Both primary axes in the first-trade soybean horoscope are activated by exact conjunction, a connection of culmination. The Venus/Uranus axis is being visited by the Sun, Uranus and Mercury conjunct natal Uranus. Transiting Venus is conjunct the first-trade Moon and opposite first-trade Jupiter. In July beans, the next resistance level is at the planetary price conversions of $8.73 per bu. to $8.75.
- Low in Gold on Wednesday, April 29—Transiting Moon opposes the gold market’s first-trade Venus while heavy hitters Pluto and Jupiter remain in conjunction range. Making an easy, generally supportive trine to the market’s natal Sun are three planets—the Sun (exact to the degree), Uranus and Mercury. Finally, transiting Venus is opposite gold’s natal Mars. In June gold, three planetary price conversion levels stand at $1688 per oz. to $1694.
- High in Crude Oil on Thursday, April 30—As it does once a month, the transiting Moon makes a Grand Trine with the market’s first-trade Sun and Jupiter/Uranus positions. This time, however, the transiting Sun is aligned with gold’s natal Venus, providing additional spotlight and lift. In nearby June, the important Venus conversion levels to watch include: $7.63 per barrel, $11.23, $14.83 and $18.43. In both the June and July contracts, look for planetary price conversion resistance/support at $20.80 per barrel to $21.20; then $24.90-$25.00 and $26.30-$26.90.
Can you help me find Brent crude first-trade data? I’d like to switch my ongoing analysis to ICE Brent crude oil futures from WTI at NYMEX, but need a definitive first-trade date and time to conduct my astrological research before I do. All I know right now is that the current active Brent contract at ICE launched in London at the International Petroleum Exchange in June 1988. Many thanks in advance for any data or leads on where I might find Brent crude’s launch information. Please email susan@susangidel.com.
Tuesday’s reports include:
- Monday 4:00 pm US Crop Progress
- Monday TBD Bank of Japan Announcement
- 8:30 am US International Trade in Goods
- 10:00 am US Consumer Confidence
March Review–S&P 500 Gaps Higher from Bottom
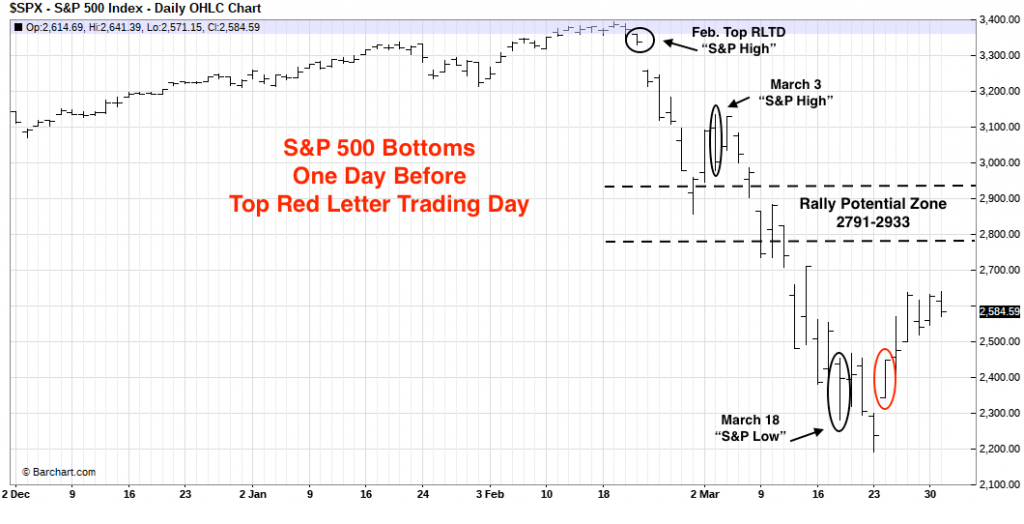
Tuesday, March 24 was the month’s Top Red Letter Trading Day for two astrological reasons: (1) the New Moon in Aries; and (2) the powerful connection between Jupiter/Pluto/Mars in Capricorn and money planet Venus in Taurus.
Any new moon signals a fresh start, but the New Moon in Aries (exact at 5:28 am) is supercharged with go-getter energy because it is in the sign ruled by Mars. At the same time, three forceful planets—Mars, Jupiter and Pluto—were within two degrees of each other in the sign of Capricorn, all of them in an easy trine (120 degrees) to money planet Venus in its ruling sign of Taurus. Mars is the agitator, while Venus controls the purse strings. Jupiter and Pluto want immense change. Indeed, the market bottomed on March 23 as U.S. legislators got serious about a $2.2 trillion stimulus bill, which was signed by March 27, a day before Venus made an exact trine with Jupiter and Pluto, which I had described as “throwing a lot of money at a big problem.”
S&P 500 High/Low Forecasts
In the chart above, the days with black circles around are those that I had forecast as potential market highs or lows in my special report, “2020 Outlook—Standard & Poor’s 500,” released in mid-January as well as in the Red Letter Trading Days newsletter. The dotted lines represent a potential rally range (described at the top of this newsletter) as the S&P 500 rebounds, into early May at the outside.
All information in this newsletter is merely the personal opinion of the author and not that of any other person, company or entity. This information is not to be construed as financial advice, nor relied upon as such. Please contact your broker or financial advisor for trading and investment advice. Past results are not necessarily indicative of future market behavior.
© Copyright 2020 SusanGSays LLC