© Copyright 2021 SusanGSays LLC
Small-sized “micro” futures contracts have been a big hit at the CME Group since it introduced them on stock index futures in May 2019, bitcoin in May 2021, and crude oil on July 11, 2021. Now, four more micros—on U.S. Treasuries—will begin trading on Sunday, August 15 at 5:00 pm (Central) for trade date August 16.
In the reverse of larger-sized futures contracts, the Micro Treasury Yield futures contracts—covering the 2-yr., 5-yr., 10-yr. and 30-yr. spectrum—will track interest rate yield, not price. (Yay! A contract that matches how we all talk/read about interest rates!) Each is sized at $10 per basis point of yield (0.01%) and will be cash-settled to newly created cash U.S. Treasury benchmarks from BrokerTec, the leading cash US Treasury trading platform.
I’m focusing on the Micro 10-yr. Treasury Yield futures contract because: (1) the United States has issued 10-yr. T-notes since 1791, and (2) the 10-yr. T-note futures contract is the most popular Treasury futures contract, with volume in July of 32.5 million contracts.
Astrology Connects Across 230 Years
It is fascinating to me how related markets connect to each other across the years. The new Micro 10-yr. Treasury Yield futures contract takes that to an entirely new level because it is astrologically connected to both the cash market start in 1791 (230 years ago) and the futures start in 1982 (39 years ago).
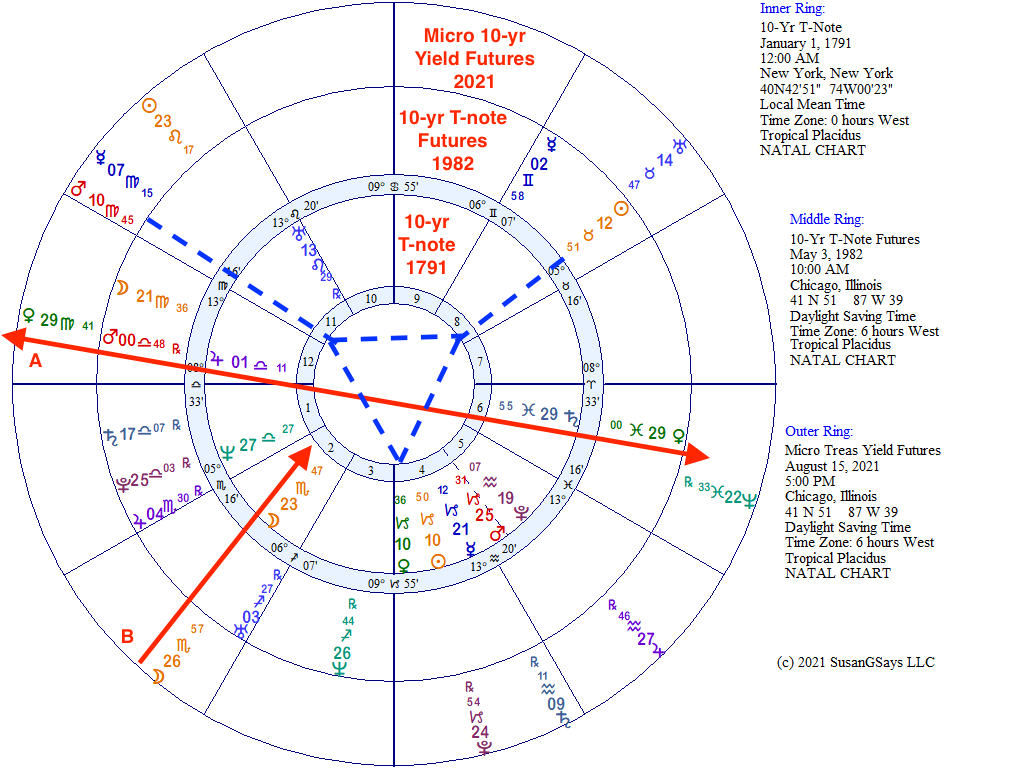
In the chart below, I’ve put the first-trade horoscope wheels of these three markets into one graphic. The center wheel is the start to the U.S. 10-yr. Treasury Note on January 1, 1791; the middle wheel is when 10-yr. T-note futures launched on May 3, 1982; and the outer wheel is the launch for the Micro 10-yr. Treasury Yield futures contract on August 15, 2021. The red double-arrow line marked A shows how all three first-trade horoscopes are connected to one another. This astrological connection—across three markets and 230 years—emphasizes the importance of that axis in analyzing how the market might behave when planets in the sky move across it. Indeed, it was a marker of significant highs and lows in research I published about 10-yr. T-note futures in my 2018 book, “Trading In Sync With Commodities—Introducing Astrology To Your Financial Toolbox.”
1791—U.S. 10-yr. Treasury Notes
This instrument was the first offered by the newly formed U.S. Treasury (1789) and its Secretary Alexander Hamilton. It was developed to pay debts accumulated during the Revolutionary War. The federal government assumed $21.5 million in debt from the states, and, in return, provided the states with U.S. Treasury securities that paid 6% interest.
The Funding Act of 1790 went into effect on the first day of 1791, less than a month after Jupiter and Saturn made the first of their five oppositions that ran from December 7, 1790 to September 14,1792. This opposition is the base axis of red line A in the chart above. Note that it lies essentially on the world axis marked by 00 degrees of Cardinal signs Libra and Aries, making this event important to the world.
About 10 years earlier, in 1782, Jupiter and Saturn had started their 20-year cycle by joining at the same degree of Sagittarius on November 5. That same year, Revolutionary War peace negotiations began between the United States and Great Britain, with the draft of the treaty completed just three weeks after the Jupiter/Saturn conjunction. (The ultimate Treaty of Paris was signed on September 3, 1783.) Thus, the theme of the Revolutionary War is represented in the horoscopes for both the Jupiter/Saturn conjunction and their opposition, which occurs halfway through their cycle.
Jupiter and Saturn mark 20-year economic cycles that begin at each conjunction, which indicate a breaking free of structures and restrictions in order for new growth to start, which certainly is represented by the Treaty of Paris. At the opposition—when the 10-yr. Treasury note was developed to pay off Revolutionary War debt—it is a time to expand and assume more responsibilities in a structured way. The opposition also can bring a peak in market optimism. Indeed, the U.S. stock market suffered its first financial “panic” during this period, in March 1792, which led to formation of the New York Stock Exchange in May 1792.
1982—10-yr. T-note Futures
The 10-yr. T-note futures contract set an opening-day trading volume record of 33,502 contracts that stood for nearly 40 years, until the launch of Micro E-mini stock index futures in 2019. Its astrological connection with the cash market started 191 years earlier is impressive.
Note in the middle wheel of the chart above, along Line A, how Mars at 00 Libra is conjunct the cash instrument’s first-trade Jupiter and how Venus is in the same degree of Pisces (its absolute favorite sign) as the cash market’s natal Saturn. Mars represents action and Venus represents money, so this new contract offered a new way to trade and make money in 10-yr. T-notes.
2021—Micro 10-yr. T-note Yield Futures
If the futures/cash market astrological connection was impressive, the latest addition to the 10-yr. T-note market collection is downright stunning.
First, the micro futures first-trade Venus is right on Line A, conjunct the bigger futures’ Mars and cash market’s Jupiter while opposite the cash market’s Saturn and bigger futures’ Venus—those two at exactly the same degree, but opposite sign. All this for markets that began to trade either 39 or 230 years apart from one another. Plus, Venus in the micro futures horoscope is just hours away from entering its ruling sign of Libra at 11:27 pm on August 15.
Second, at Line B, the micro futures first-trade Moon is just 3 degrees beyond the natal Moon for the cash T-note. Recall that these two markets launched 230 years apart—and that the Moon goes entirely around the chart every month—yet their Moons are less than six hours of time away from being exactly at the same degree and minute of astrological position.
Third, the blue dotted lines show that the micro futures’ first-trade Mars/Mercury at 7-10 Virgo form a Grand Trine in Earth with the bigger futures’ natal Sun at 12 Taurus and the cash market’s natal Sun/Venus at 10 Capricorn. This provides a steadiness among the three markets—almost as if the first two were waiting for the third to arrive and supply the third leg of the stool.
Market Connections Abound
It is interesting that Venus, the planet that rules money and represents money, plays such an important role across these charts. It is in stable Capricorn and conjunct by degree to the Sun (identity) in the cash market chart; it rules Taurus, placement of the 1982 futures market’s first-trade Sun. And, it is prominent in all three horoscope charts—conjunct the Sun in 1791; conjunct the 1791 Saturn from the 1982 futures chart; and conjunct the 1791 Jupiter from the 2021 futures chart.
The latest addition to the trading suite of 10-yr. T-note markets absolutely points to the significance of the cash market’s initial Jupiter/Saturn opposition axis near the world axis of 00 Aries (29 Pisces Saturn) and 00 Libra (01 Libra Jupiter) in watching for planetary transits that could affect market structure and prices. An easy way to remember to be on alert is to watch the spring and fall equinox, when the Sun crosses the world axis, or any other planets as they enter Aries or Libra.
Click here to learn more about Micro Treasury Yield futures at CME Group.