By Susan Abbott Gidel
© 2021 SusanGSays LLC
The soybean market and astrology have a good working relationship, particularly as it concerns the Moon. This year, the soybean market has shown striking sensitivity to New Moons and Full Moons, making significant highs or lows within a day or two. This month’s New Moon (when the Sun and Moon are in the same degree and sign of the zodiac) on Thursday, June 10 is also a solar eclipse, which increases its normal New Moon influence and strength.
But, it’s a triple-whammy day for soybeans on June 10:
- First, it is a New Moon that could continue this year’s pattern of setting a low as it did at the previous Full Moon.
- Second, the New Moon eclipse is conjunct the soybean market’s own Moon in its first-trade chart.
- Third, this all happens on the same day as the monthly Crop Production report that will project the size of the 2021 crop, an important fundamental factor to the market.
Soybeans and the Moon
Conjunctions to the soybean market’s first-trade Moon are often an indicator of a market high, including those in 1973, 1977, 1988, 1996, 2009, 2012 and 2016. Some of the market’s biggest highs were when the transiting Sun was conjunct the market’s first-trade Moon, like it will be on June 10, 2021:
- June 5, 1973 at $12.90 per bu.
- June 11, 2009 at $12.91 ¼
- June 10, 2016 at $12.08 ½
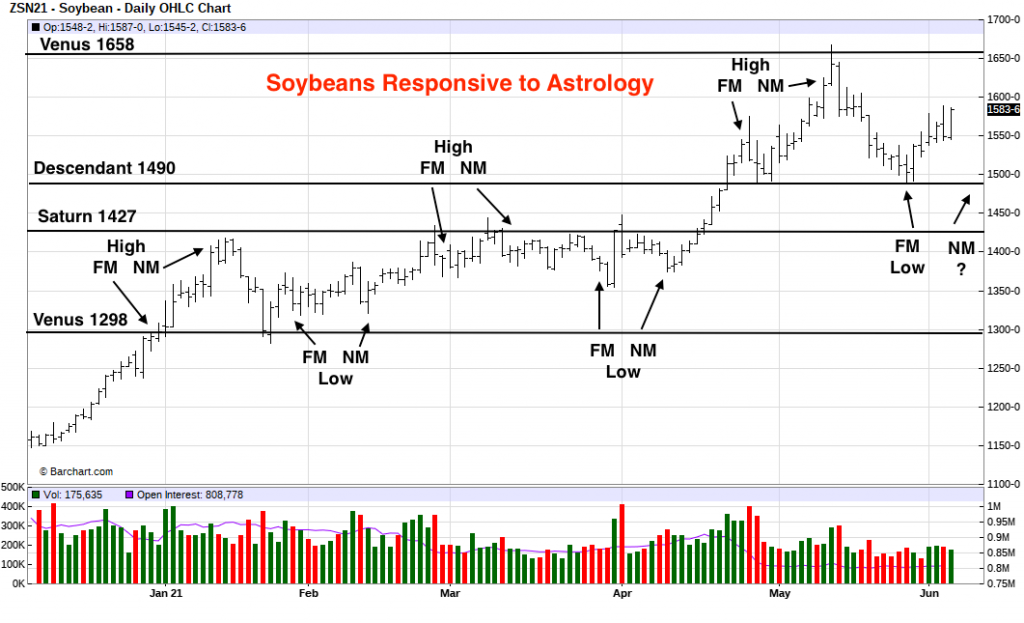
However, do be on alert for June 10 making a significant low as well, based on this year’s pattern of a pair of lows or highs at every pair of Full Moons/New Moons. Here’s how soybeans have behaved this year (Chart 1):
- Lows at the Full Moon of Jan. 28 and New Moon of February 11
- Highs at the Full Moon of February 27 and New Moon of March 13
- Lows at the Full Moon of March 28 and New Moon of April 11
- Highs at the Full Moon of April 26 and New Moon of May 11
- Low at the Full Moon of May 26 and (Low? High?) at New Moon of June 10; will the eclipse break the pattern?
This is not the first time that soybean prices have had a noticeable affinity for turning close to the New Moon or Full Moon. In 2019, the soybean market made a low near the New Moon in February. Then, prices made highs near each Full Moon from March through October, except April. Prices made lows again in November and December around the New Moon.
Prices and First-Trade Conversion Levels
One way to use astrology with the markets is to convert the position of planets in the market’s first-trade horoscope (cast for the date, time and location at the market’s launch) into price. This is done by assigning each degree of the zodiac a value of 0-359, starting with 0 Aries (0) and ending with 29 Pisces (359). Then, add 360 for each next level of value higher, as high as you need to go.
For soybeans, the astrological conversion levels of first-trade Venus (08 Scorpio = 218) and first-trade Saturn (17 Pisces = 347) dominate important long-term support/resistance levels on the monthly charts. For example, the 1973 high of $12.90 that stood for nearly 35 years was 8 cents shy of the Venus conversion level of 1298. The all-time high in soybeans from 2012 at $17.94 ¾ was 7 cents beyond the Saturn conversion level of 1787.
In the current market, important price levels to watch (shown on Chart 1) are the Venus conversion levels of 1658 (May 12 high of $16.67 ½, basis July) and 1298 (January 2021 low in nearby March beans of $12.98), and the Saturn conversion levels of 1427 and 1787 (2012 high of $17.89).
Mercury Retrograde Influence
All of this upcoming price activity occurs while Mercury is retrograde in motion, i.e., appearing to move backwards in the sky. One market-oriented theory among astrologers is that prices essentially move sideways during the retrograde period, “re”-tracing the range established when Mercury was in its pre-retrograde “shadow” period, which is defined as the time Mercury spends in the same degrees it travels while retrograde.
In this retrograde period, Mercury started moving backwards at 24 degrees Gemini on May 29 and will turn around to move forward at 16 degrees Gemini on June 22. Thus, the shadow period was when Mercury was traveling from 16-24 degrees Gemini from May 15-May 29. During these 14 days, the range in July soybeans was between a high of $16.12 ¾ on Friday, May 14 and a low of $14.89 1/3 on Wednesday, May 26.
In the year’s first Mercury retrograde from January 30-February 20, July soybean prices traded in a range between $13.86 and $13.21, well within the pre-retrograde shadow’s range of $14.16-$12.82, basis July.
Summing Up
- Soybeans could make a high on June 10 as the New Moon/Solar Eclipse conjoins the market’s first-trade Moon position.
- Soybeans could make a low on June 10 if this year’s pattern of lows/highs with consecutive Full Moons/New Moons holds.
- If prices rally, the Venus conversion level of $16.58 (and May 12 high of $16.67 ½, basis July) could provide significant resistance. In addition, the Mercury retrograde shadow period high for July beans is $16.12 ¼, another potential resistance area.
- If prices fall, the Descendant conversion level of 1490 (matching the April 28 and May 26 lows in July beans of $14.90 ½ and $14.89 ¼, respectively) could provide support. This price also is the low of the range during Mercury’s pre-retrograde shadow period. From a technical analysis standpoint, this level could mark the base of a head-and-shoulders top in July soybeans, which projects a downside move to $13.13 if it fails. This is near the Ascendant conversion level of 1310.